fr
de
it
en
es
nl
 Visitor Anonymous 
Homepage
Data base
 - 
Homepage data base
 - 
Our charter
  Sightings
    - 
Annual reports
  Galleries
    - 
All pictures
  Stats
Migration sites
Resources and links
The Migration Study Group
Our partners
Annual reports : Col du Fau, 2026
Watchpoint
Graphs
News
Bird Reports
See cumulative daily totals and phenology graphs
 
Not available. This representation exists with one or all sites, one or all years and a single species.

Comparison of the duration of migration : This graph compares the duration of migration in number of days between different key percentages of migration. It is possible to compare several sites on the same graph.
Not available. This representation exists with one or all sites, one or all years and a single species.

Comparison of migration dates : This graph matches key percentages of migration with calendar days. It is possible to compare several sites in the same graph.
Not available. This representation exists with a single site, all years and a single species.

Interannual trend : This interannual graph represents the evolution between annual totals.
Not available. This representation exists with a single site, one or all years and a single species.

Phenological trend : This graph represents the evolution of the percentage of migration. Key percentages are indicated by vertical red bars.
Not available. This representation exists with a single site, all years and a single species.

Daily evolution : This interannual graph represents the trend of dates and key percentages of migration.
Not available. This representation exists with a single site, one or all years and a single species.

Totals by hour : This graph represents the distribution of the total number of birds by hour. When a specific year is chosen, the average of all the years of the migration watch is shown in grey.
Not available. This representation exists with a single site, one or all years and a single species.

Seasonal phenology : This graph represents the distribution of the daily passage total (the decadary total is symbolized by red bars). If a specific year is selected, the average of all years is shown in grey.
Not available. This representation exists with a single site, one or all years and a single species.

Relative migration : This graph represents the distribution in daily percentage of migration (percentage by decade being symbolized by red bars). If a specific year is chosen, the average of all years is shown in grey.
Not available. This representation exists with a single site, one or all years and a single species.

Seasonal phenology (decade) : This graph represents the migration total by decade. If a specific year is selected, the average of all years of the migration survey is shown in grey.
Not available. This representation exists with a single site, one or all years and a single species.

Hourly mean per decade : This graph shows the mean number of migrants per hour over ten-day periods. When a specific year is selected, the mean number of migrants calculated over all years of record is depicted in grey.
Not available. This representation exists with a single site, one or all years and a single species.

Seasonal phenology (5-day period) : This graph shows the numbers of migratory individuals over 5-day periods. If a specific year is selected, the average of all years is shown in grey.
Not available. This representation exists with a single site, one or all years and a single species.

Hourly mean per 5-day period : This graph shows the mean number of individuals per hour over 5-day periods. When a specific year is selected, the mean number of migrants calculated over all years of record is shown in grey.
Available. This representation exists with a single site, a single year and all the species.

Summary table : This graph represents the seasonal totals as well as the latest totals of the migration watch. The upper table represents the most significant species for the watchpoint.
Available. This representation exists with a single site, a single year and all the species.

Migration synthesis : This graph is representing migration periods for each species at the site in a given year
Available. This representation exists with one or all sites, one or all years and all the species.

Observation effort : This table shows the observer pressure at the watchpoint for all years or day by day for a selected year.
Not available. This representation exists with all sites combined, one or all years and a single species.

Distribution Map : This map shows the relative importance of the watchpoints for a selected species. The dots represent the number of individuals per season.

Period : from Saturday, September 19th, 2026 until Monday, October 5th, 2026

Number of days of migration watch : 7
Number of hours of migration watch : 57h20

Number of birds : 14393
Monday  2026 07h35-12h25- Duration : 04h50 
Waning Crescent (23 days) : Moonrise at 1h17 and moonset at 16h51
Sun : sunrise at 07h40 and sunset at 19h10
Day : dawn at 07h11 and dusk at 19h39
Comments :
07h35-12h25 : Arthur Brunel, Pérrine Aligier, Philippe Menanteau et Philippe Argée
 The most significant species
Total
    Eurasian Sparrowhawk (Accipiter nisus)
78
    Common Buzzard (Buteo buteo)
72
    Common Kestrel (Falco tinnunculus)
435
    Eurasian Hobby (Falco subbuteo)
15
    Common Wood Pigeon (Columba palumbus)
184
    Woodlark (Lullula arborea)
8
    Eurasian Skylark (Alauda arvensis)
79
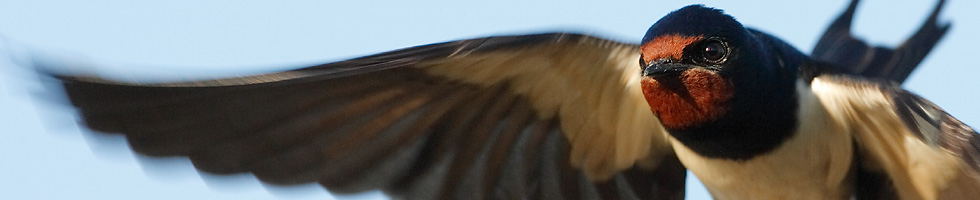
    Barn Swallow (Hirundo rustica)
5137
    Western House Martin (Delichon urbicum)
1268
   Tree Pipit (Anthus trivialis)
103
    Meadow Pipit (Anthus pratensis)
718
    Western Yellow Wagtail (Motacilla flava)
31
    White Wagtail (Motacilla alba)
307
    Song Thrush (Turdus philomelos)
355
    Mistle Thrush (Turdus viscivorus)
67
    Eurasian Blue Tit (Cyanistes caeruleus)
7
    Common Starling (Sturnus vulgaris)
2526
    Eurasian Chaffinch (Fringilla coelebs)
1999
    European Serin (Serinus serinus)
64
    European Goldfinch (Carduelis carduelis)
29
    Eurasian Siskin (Spinus spinus)
174
    Hawfinch (Coccothraustes coccothraustes)
18
    Yellowhammer (Emberiza citrinella)
13
  Daily total
4
migrants
2
migrants
1
migrant
1
migrant
74
migrants
1
migrant
41
migrants
19
migrants
3
migrants
3
migrants
89
migrants
10
migrants
9
migrants
51
migrants
11
migrants
3
migrants
505
migrants
199
migrants
2
migrants
7
migrants
18
migrants
8
migrants
2
migrants
 Other species
Total
   Griffon Vulture (Gyps fulvus)
-
   Merlin (Falco columbarius)
1
    Stock Dove (Columba oenas)
168
   Black Woodpecker (Dryocopus martius)
-
   Middle Spotted Woodpecker (Dendrocoptes medius)
-
    Northern Wheatear (Oenanthe oenanthe)
3
   Western Jackdaw (Coloeus monedula)
87
    Common Linnet (Linaria cannabina)
86
    Red Crossbill (Loxia curvirostra)
9
  Daily total
+ 4 erratic
1
migrant
11
migrants
+ 1 local
+ 1 erratic
1
migrant
35
migrants
30
migrants
7
migrants
Visionature
VisioNature est un outil développé avec la collaboration du réseau LPO. Grâce aux technologies Internet, débutants, amateurs et professionnels naturalistes, peuvent partager en temps réel leur découverte et ainsi améliorer la connaissance et la protection de la faune
Biolovision Sàrl (Switzerland), 2003-2026